Upblit
AboutOpen SourceCommunityDeveloperContactPricing
Star on GitHub—Sign in
AI-assisted operations for production systems

Telemetry review for teams operating real software.

Upblit unifies logs, traces, metrics, API keys, and runbook intelligence into a dark-first workspace designed for incident response and production clarity.

Start with GitHub Inspect the cockpit
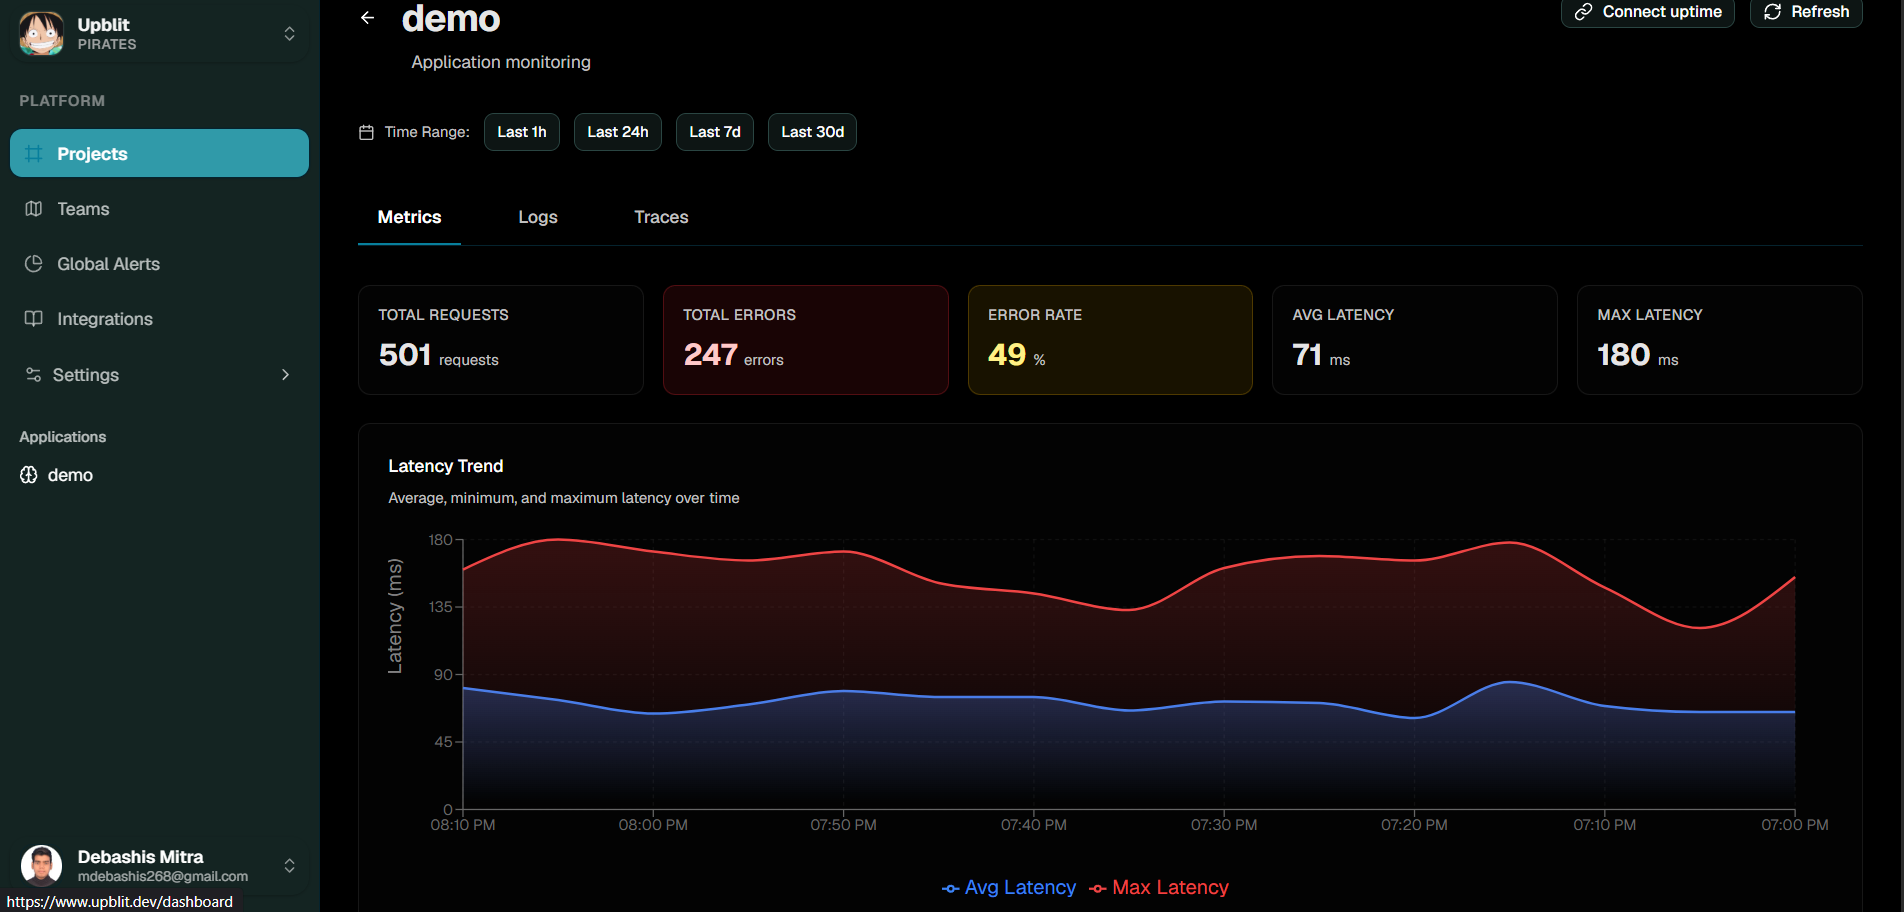
p95 latency
128ms-18%
error rate
0.12%stable
trace volume
2.4M+31%
Built from the backend upSDK-first telemetryScoped API keysTenant-aware AI docs

Incident cockpit

acme-production / checkout

streaming
Signal health15m
Logs86%
Traces72%
Metrics94%
Docs61%
AI runbook match

Payment timeout resembles incident INC-042. Check queue depth, gateway retry volume, and worker pool saturation.

Trace timelineERROR spike
12:04:11.204checkout-api

POST /orders accepted

INFO
12:04:11.391payment-worker

authorization latency p95 crossed

WARN
12:04:11.883gateway

retry policy activated

INFO
12:04:12.102ai-docs

runbook matched: queue pressure

MATCH
12:04:12.560checkout-api

payment timeout threshold exceeded

ERROR

Product architecture

A clean signal path from runtime to review.

Upblit is organized around the production hierarchy your team already uses: organizations, projects, applications, API keys, ingest, and incident review.

SDKs

Express, Python, Go, and Spring services emit spans, metrics, logs, and app identity.

API keys

Scoped application keys keep ingest boundaries clean across environments.

Ingest pipeline

Logs and telemetry are normalized with project, org, trace, and application context.

Review cockpit

Engineers inspect timelines, runbooks, and correlated signals from one surface.

Feature system

Composed surfaces, not a wall of cards.

Every section is arranged around the actual operational objects in Upblit: logs, traces, metrics, documents, applications, and incident review.

Logs

Searchable production logs with trace context.

Log review stays connected to the service, project, severity, and request path that produced it. The interface is intentionally dense so responders can scan quickly under pressure.

Level-aware filtering
Trace ID correlation
Auto-refresh ready
Structured payloads
logs surface
live
trace_00a9491ms
trace_01a9182ms
trace_02a9491ms
trace_03a9182ms
trace_04a9491ms

Traces

Request waterfalls that explain latency.

Telemetry rows expand into span timelines with parent-child relationships, response status, method, URL, and duration.

Span hierarchy
Duration hotspots
Status mapping
Incident timeline
traces surface
live
trace_10a9491ms
trace_11a9182ms
trace_12a9491ms
trace_13a9182ms
trace_14a9491ms

AI Docs

Runbooks surfaced beside the incident.

Upload operational docs and keep retrieval scoped to the tenant. Upblit AI becomes a focused assistant for engineering context, not a disconnected chatbot.

PDF/DOCX/TXT
Tenant-aware search
Runbook summaries
Document deletion
ai docs surface
live
trace_20a9491ms
trace_21a9182ms
trace_22a9491ms
trace_23a9182ms
trace_24a9491ms

Dashboard preview

A production cockpit with real information density.

Review service health, trace waterfalls, matching docs, and incident context from the same visual plane. It is built to be scanned, not admired from a distance.

Incident cockpit

acme-production / checkout

streaming
Signal health15m
Logs86%
Traces72%
Metrics94%
Docs61%
AI runbook match

Payment timeout resembles incident INC-042. Check queue depth, gateway retry volume, and worker pool saturation.

Trace timelineERROR spike
12:04:11.204checkout-api

POST /orders accepted

INFO
12:04:11.391payment-worker

authorization latency p95 crossed

WARN
12:04:11.883gateway

retry policy activated

INFO
12:04:12.102ai-docs

runbook matched: queue pressure

MATCH
12:04:12.560checkout-api

payment timeout threshold exceeded

ERROR
sdk-ingest.ts
1import { upblit } from '@upblit/sdk'
2const span = upblit.trace('checkout.create')
3logger.warn('payment latency high', { traceId })
4await upblit.metric('queue.depth', depth)
5await span.end({ status: 'retry_scheduled' })

Developer experience

Simple ingest. Clear ownership. Useful defaults.

SDKs and API routes map directly to teams, projects, applications, and telemetry. The product avoids mystery abstractions so production context remains inspectable.

Typed client helpers and clear API boundaries.

Organization, project, and application hierarchy.

Auto-refresh patterns for high-pressure incident review.

Docs and runbooks linked directly into telemetry analysis.

Engineering controls

Practical boundaries for a student-built observability system.

Upblit focuses on the controls that matter while the product is still engineering-led: auth, scoped keys, tenant boundaries, explicit deletion, and telemetry shapes that are easy to inspect.

GitHub OAuth sign-in
Scoped application API keys
Organization/project boundaries
Trace-aware log context
Document tenant separation
Explicit delete paths
Backend-owned token refresh
Audit-friendly event shape
Privacy policyTermsCookie policyData retention

Built for engineers first

A serious observability workbench for people who read logs.

Start with GitHub OAuth, then move into projects, applications, API keys, telemetry, logs, and AI-assisted incident context. The product should feel useful before it tries to sound important.

Sign in with GitHub
Upblit

A student-built observability workbench for logs, traces, metrics, API keys, and AI-assisted incident notes.

OAuthAPI scopesTrace contextRetention notes

Product

  • Architecture
  • Dashboard preview
  • AI docs
  • Security
  • Pricing

Developers

  • Developer docs
  • API reference
  • Changelog
  • GitHub
  • Status

Company

  • Support
  • Contact
  • Docs
  • Dashboard
  • Sign in

Legal

  • Privacy Policy
  • Terms
  • Cookie Policy
  • Acceptable Use
  • Data Retention
  • Data Processing

Copyright 2026 Upblit. All rights reserved.

Built for telemetry review, API operations, and incident response.